Network Segmentation Quick Start
Get up and running with Network Segmentation Analysis in just a few steps.
Prerequisites
Before you begin, ensure you have:
- Discovery agents deployed and collecting data
- Discovery schedules configured with IP ranges
- Network connection data being collected from servers
Step 1: Access Network Segmentation
- Navigate to CMDB in the main menu
- Click on Network Zones in the submenu
- The Network Segmentation Analysis dashboard will load
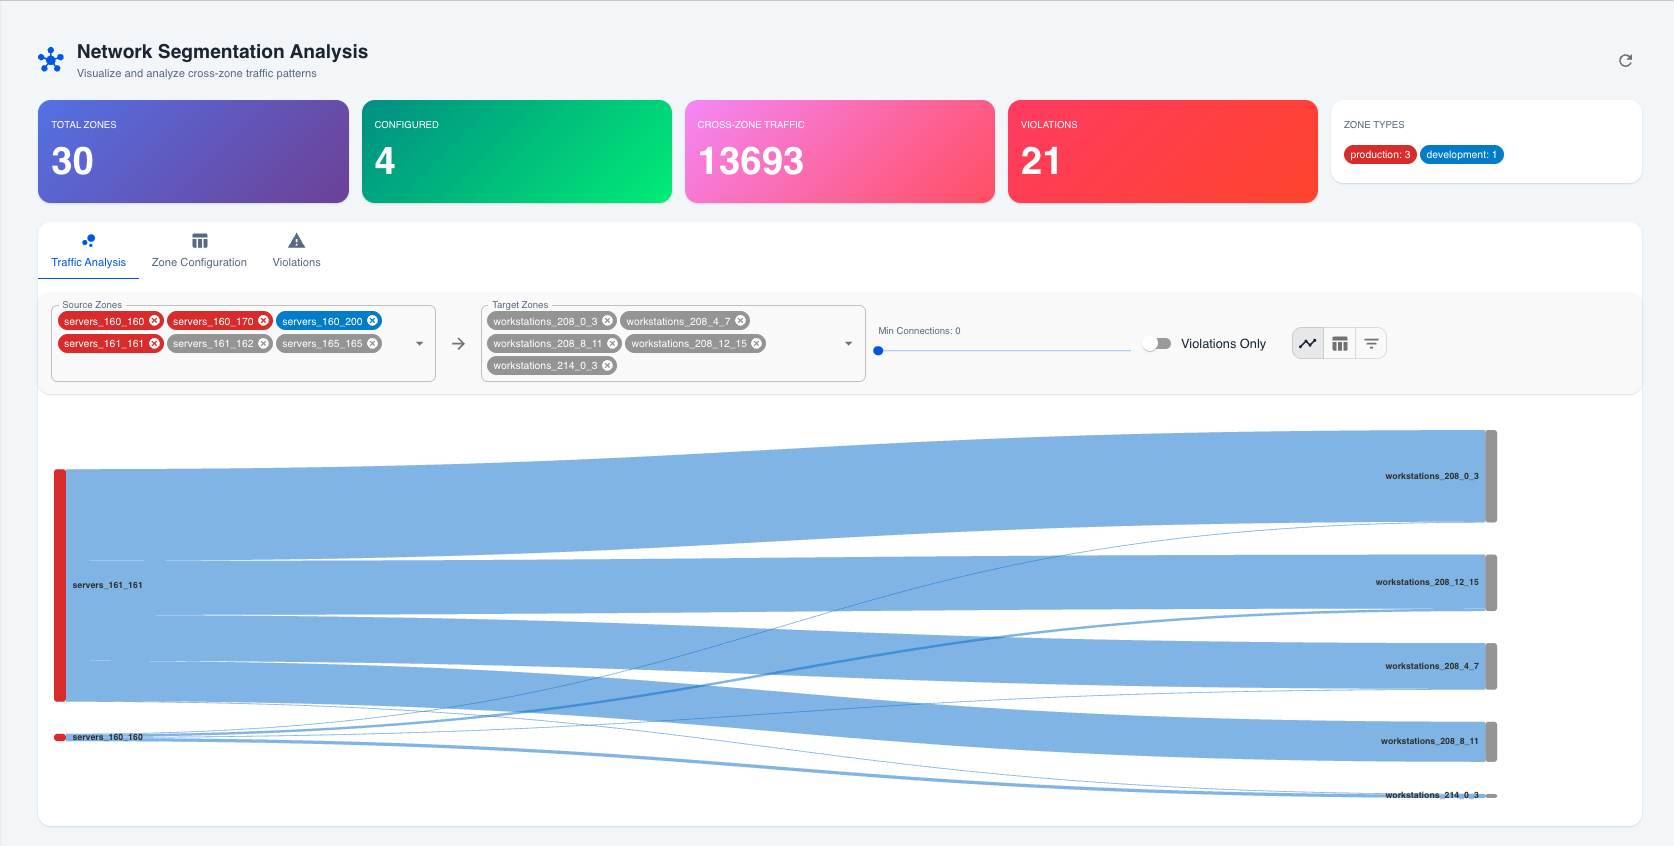 Network Segmentation Analysis dashboard with Sankey diagram view
Step 2: Review Your Zones
The dashboard automatically displays all network zones derived from your discovery schedules:
| Column | Description |
|---|---|
| Zone Name | Auto-generated from discovery schedule |
| IP Range | The network subnet covered |
| Agent | Discovery agent managing this zone |
| Zone Type | Classification (if configured) |
| Security Level | Priority level (if configured) |
Step 3: Configure Zone Types
For each zone, click the Edit button to configure:
-
Zone Type: Select the appropriate classification
- Production, DMZ, Management, Workstation, IoT, Guest, Development, Staging, Backup
-
Security Level: Set the protection priority
- Critical, High, Medium, Low
-
Allowed Inbound: Select which zones can connect TO this zone
- Leave empty to allow all (no violations generated)
- Select specific zones to enforce strict policies
-
Click Save Configuration
Step 4: View Traffic Analysis
Switch to the Traffic Analysis tab to see:
- Cross-zone traffic flows visualized
- Connection counts between zones
- Ports used for communications
- Violation status for each flow
Using Filters
- Source Zones: Select one or more zones to filter by origin
- Target Zones: Select one or more zones to filter by destination
- Min Connections: Adjust slider to show only high-volume traffic
- Violations Only: Toggle to focus on policy violations
Choosing Views
- Flow Diagram: Best for presentations and overview
- Matrix View: Best for detailed analysis (recommended)
- List View: Best for quick scanning
Step 5: Investigate Violations
Switch to the Violations tab:
- Review the list of detected violations
- Note the severity (High or Medium)
- Click Investigate on any violation
- View the IP-by-IP connection details:
- Source IP addresses
- Target IP addresses
- Number of connections
- Destination ports
Step 6: Take Action
For each violation, decide:
If Traffic is Legitimate
- Edit the target zone's configuration
- Add the source zone to Allowed Inbound
- Save configuration
- Violation will no longer appear
If Traffic is Unauthorized
- Document the finding
- Investigate the source systems
- Implement firewall rules to block
- Create an incident ticket if needed
Example Configuration
Securing a Production Database Zone
| Setting | Value |
|---|---|
| Zone Name | Production_Databases |
| IP Range | 10.160.160.0/24 |
| Zone Type | Production |
| Security Level | Critical |
| Allowed Inbound | Application_Servers (10.160.170.0/24), Management_Zone (10.100.0.0/24) |
All other zones that attempt to connect to this database zone will generate violations.
Summary Metrics
After configuration, monitor these key metrics:
| Metric | Target | Action if Exceeded |
|---|---|---|
| Violations | 0 | Investigate immediately |
| Cross-Zone Traffic | Expected patterns | Review new flows |
| Unconfigured Zones | 0 | Complete zone setup |
Next Steps
- Overview - Detailed feature documentation
- Zone Configuration - Advanced zone settings
- Violation Investigation - Deep-dive analysis